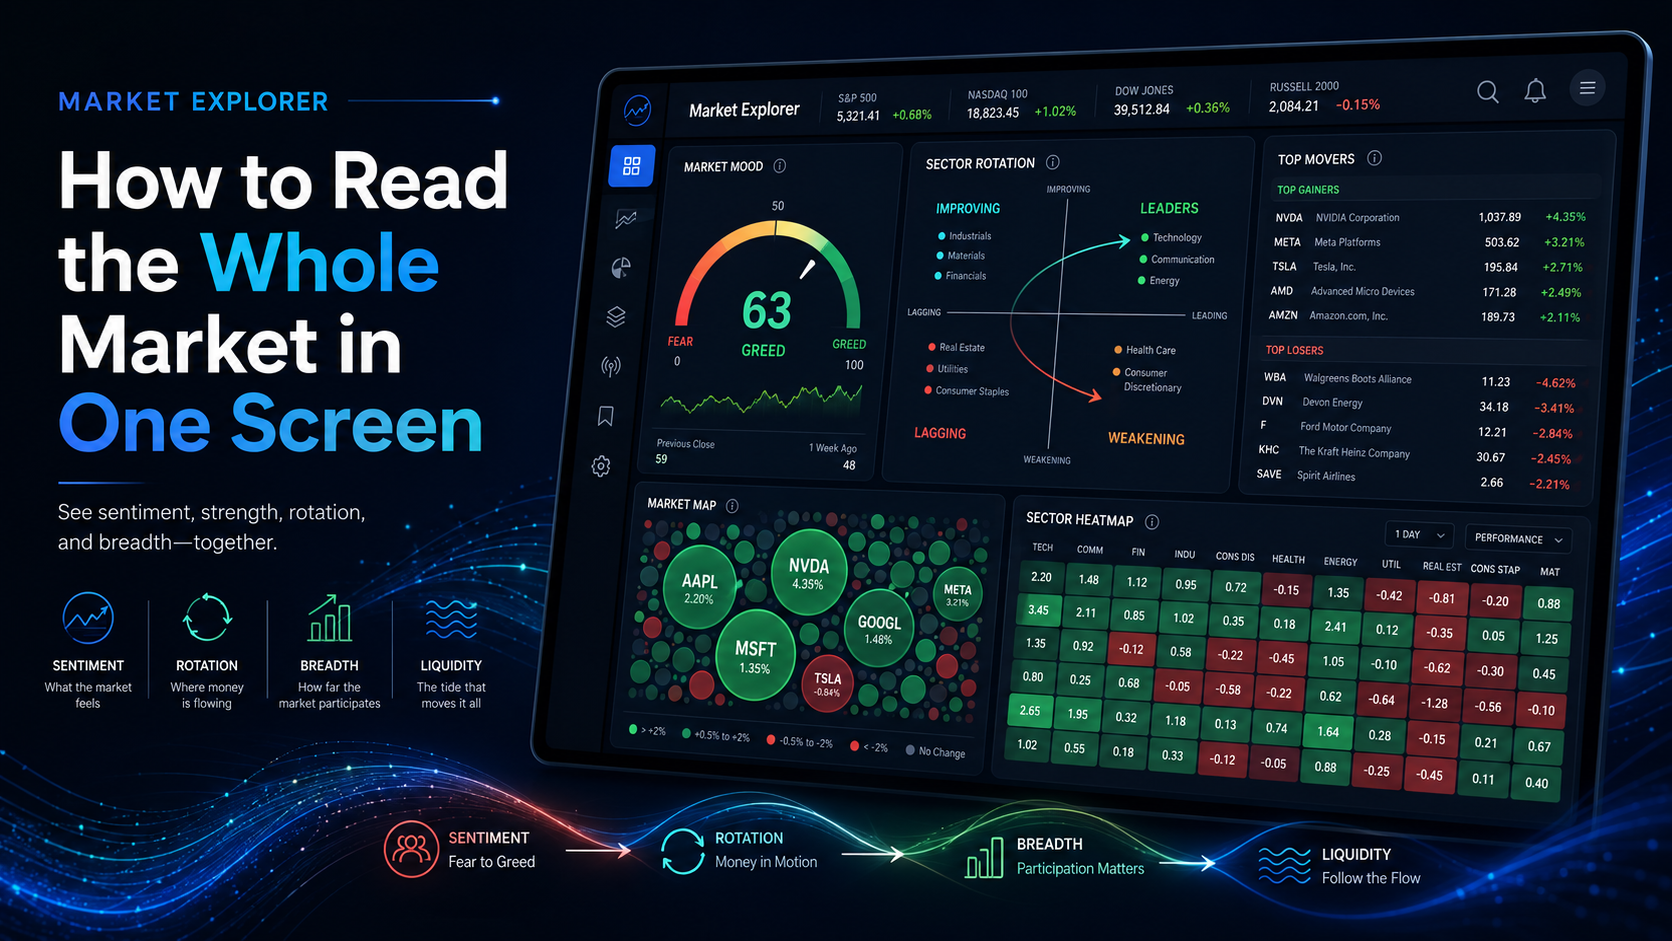
Open most finance apps and you get a wall of tickers: green here, red there, a number that went up, a number that went down. It tells you what happened. It rarely tells you what's actually going on.
Because a market isn't a list — it's a mood, a rotation, a tide. On any given day money is quietly leaving one corner and crowding into another. The headline index can be flat while everything underneath it is in motion. To make good decisions you need to read the market the way a sailor reads weather: breadth, direction, where the pressure is building.
That's what we built the Market Explorer to do. Here's how to read an entire market in a single screen.
Start with the mood, not the price
The first question isn't "is the index up?" — it's "how broad is the move?" A market where almost everything is rising is a fundamentally different place than one where three giant names are dragging a sea of red uphill.
The Market Mood gauge boils that down to one reading on a fear-to-greed scale. It blends several signals — how much of the market is trending up, how strong that momentum is, and how the cohort is leaning overall — into a single temperature from calm to euphoric. It won't tell you what to buy. It tells you what kind of room you've walked into, which is exactly the context most people skip.
Just beneath it sits a row of vital signs that puts numbers to the feeling — how big the group is, how much of it is trending upward, the typical valuation, the average yield. The gauge gives you the mood; these give you the readout behind it.
See where the money is moving
Markets rotate. Money flows out of one sector and into another, often weeks before it's obvious in the headlines. Catching that rotation early is one of the highest-value things an active investor can do.
A sector-rotation view makes this legible at a glance by plotting each sector on two axes — strength and momentum — and sorting them into four states:
- Leaders — already strong and still accelerating.
- Improving — turning the corner; strength building.
- Weakening — still strong, but losing steam.
- Lagging — weak and not yet recovering.
The interesting action is usually at the edges: a sector crossing from Improving into Leaders, or quietly slipping from Leaders into Weakening. That's rotation happening in real time.
Find the extremes worth looking at
Once you know the mood and the rotation, you want the specific names doing something unusual today. Not the whole list — the edges:
- Top gainers and losers — where the energy and the damage are concentrated right now.
- Near 52-week highs and lows — instruments at the extremes of their own range, which is often where breakouts and breakdowns begin.
These aren't recommendations; they're a shortlist of questions. Why is this one near a new high? Is this loser a falling knife or a bargain forming? The screen surfaces the candidates; you supply the curiosity.
Zoom out: the map and the heatmap
Numbers in a table are hard to feel. Two views turn the whole field into something you can take in at a glance.
The market map is a bubble view where size and position encode things like quality and value — letting you spot the clusters: the expensive-and-loved corner, the cheap-and-ignored corner, the crowded middle. Patterns that are invisible in a spreadsheet jump out when you can actually see them.
The heatmap tiles the entire market, each instrument sized by how big it is and grouped with its sector neighbours. Colour it by today's moves and you see, instantly, which corners are green and which are bleeding — and whether the action is broad or trapped in a single sector. Switch the colours to strength — our TyScore and TyPulse signals — and the same map now shows where quality and price-strength are concentrated, not just where the day went. It's the closest thing to watching the whole market breathe.
Then go narrow
Everything above works at the level of a whole market — but the same screen lets you filter down: by asset type, by sector or category, by currency, by size. The moment you do, the picture re-frames itself around that slice. The mood, the movers, the rankings all recompute for the group you actually care about. You go from "how's the market?" to "how's my corner of the market?" without changing tools.
The point: context before tickers
The mistake almost everyone makes is starting with individual tickers and never zooming out. They study a single tree very carefully while the forest is on fire — or in bloom — behind them.
Reading the whole market first flips that. You establish the weather (mood), find where the wind is blowing (rotation), spot what's at the extremes (movers), and only then drill into specific names — now with the context that tells you whether that name is swimming with the tide or against it.
That's a calmer, more deliberate way to invest. Less reacting to red and green; more understanding the current you're in. Take the temperature first. The tickers will still be there when you're ready for them.