
The Strategy Builder turns an idea into a fully back-tested portfolio in three
steps. You choose what to invest in, when the strategy acts, and how
the capital is allocated — and the platform runs the whole historical simulation
for you.
There are two ways to choose what to invest in:
- Manual basket — you hand-pick the instruments yourself.
- Automatic basket (from a Market Explorer ranking) — the platform builds
the basket for you, re-ranking the market at each point in history (available for Pro accounts only).
Everything else (timing and allocation) works the same in both modes. This guide
walks through each step and every option.
Before you start: asset type & currency
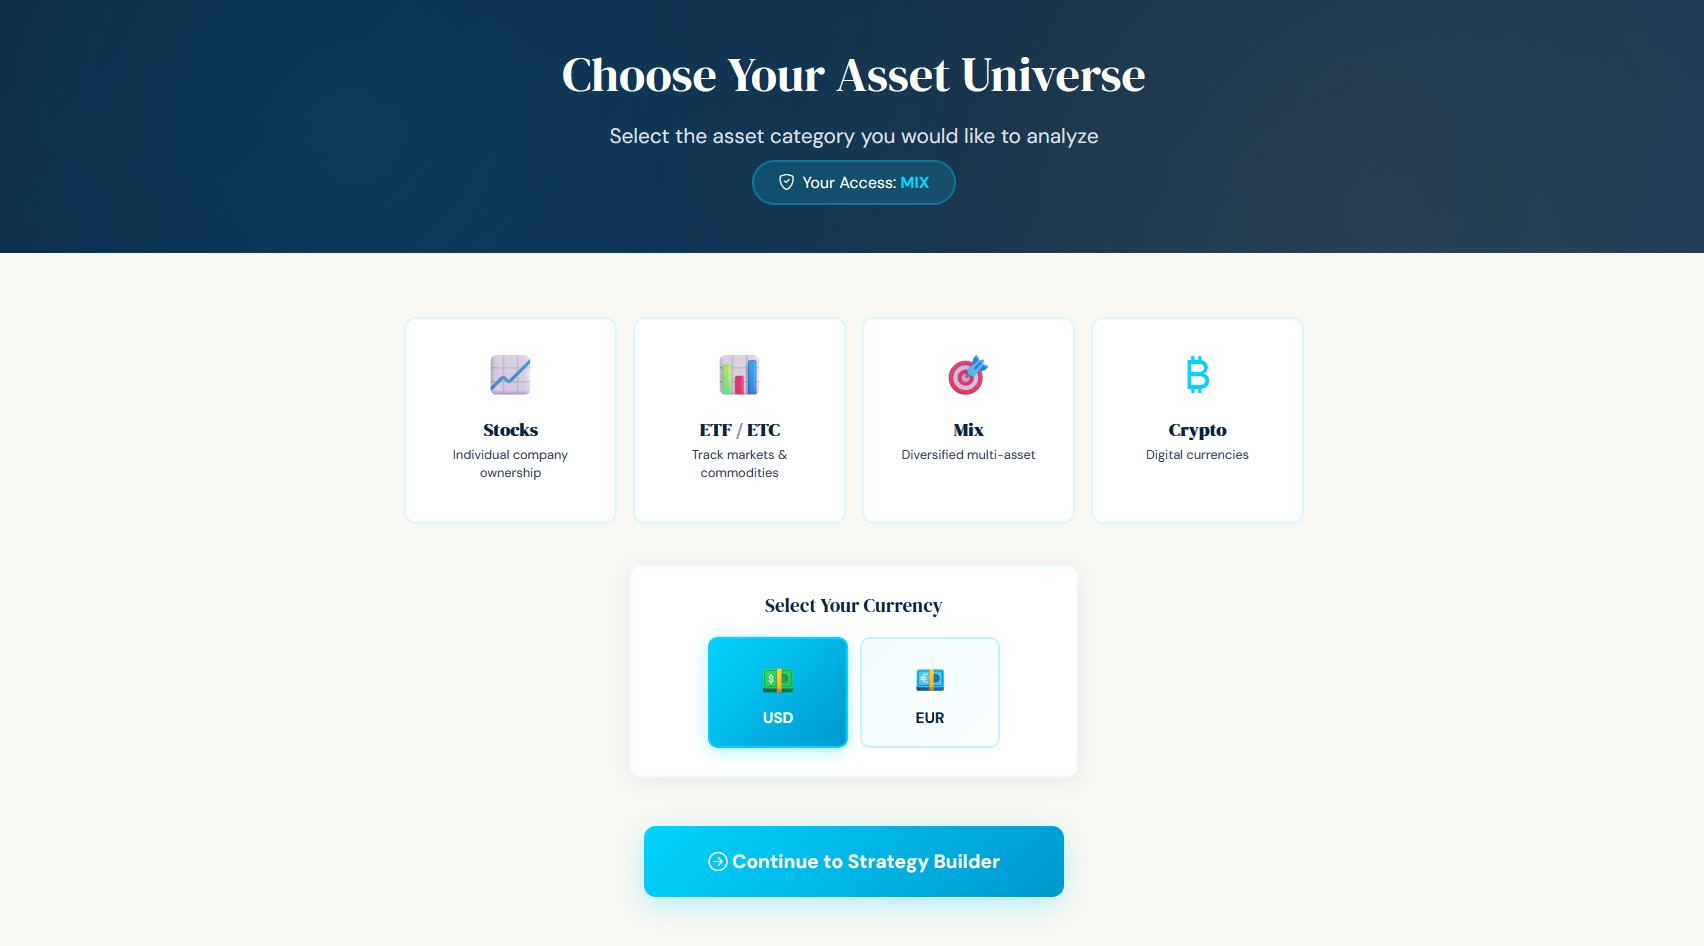
From the entry screen you first choose the asset type (Stocks, ETF, MIX, or
Crypto) and the currency (USD or EUR). This defines the pool of instruments
you can work with. The Strategy Builder never mixes currencies, so a USD strategy
only ever holds USD instruments.
Step 1 — Select Your Basket
This is where the two modes diverge.
Option A — Manual basket (hand-picked)
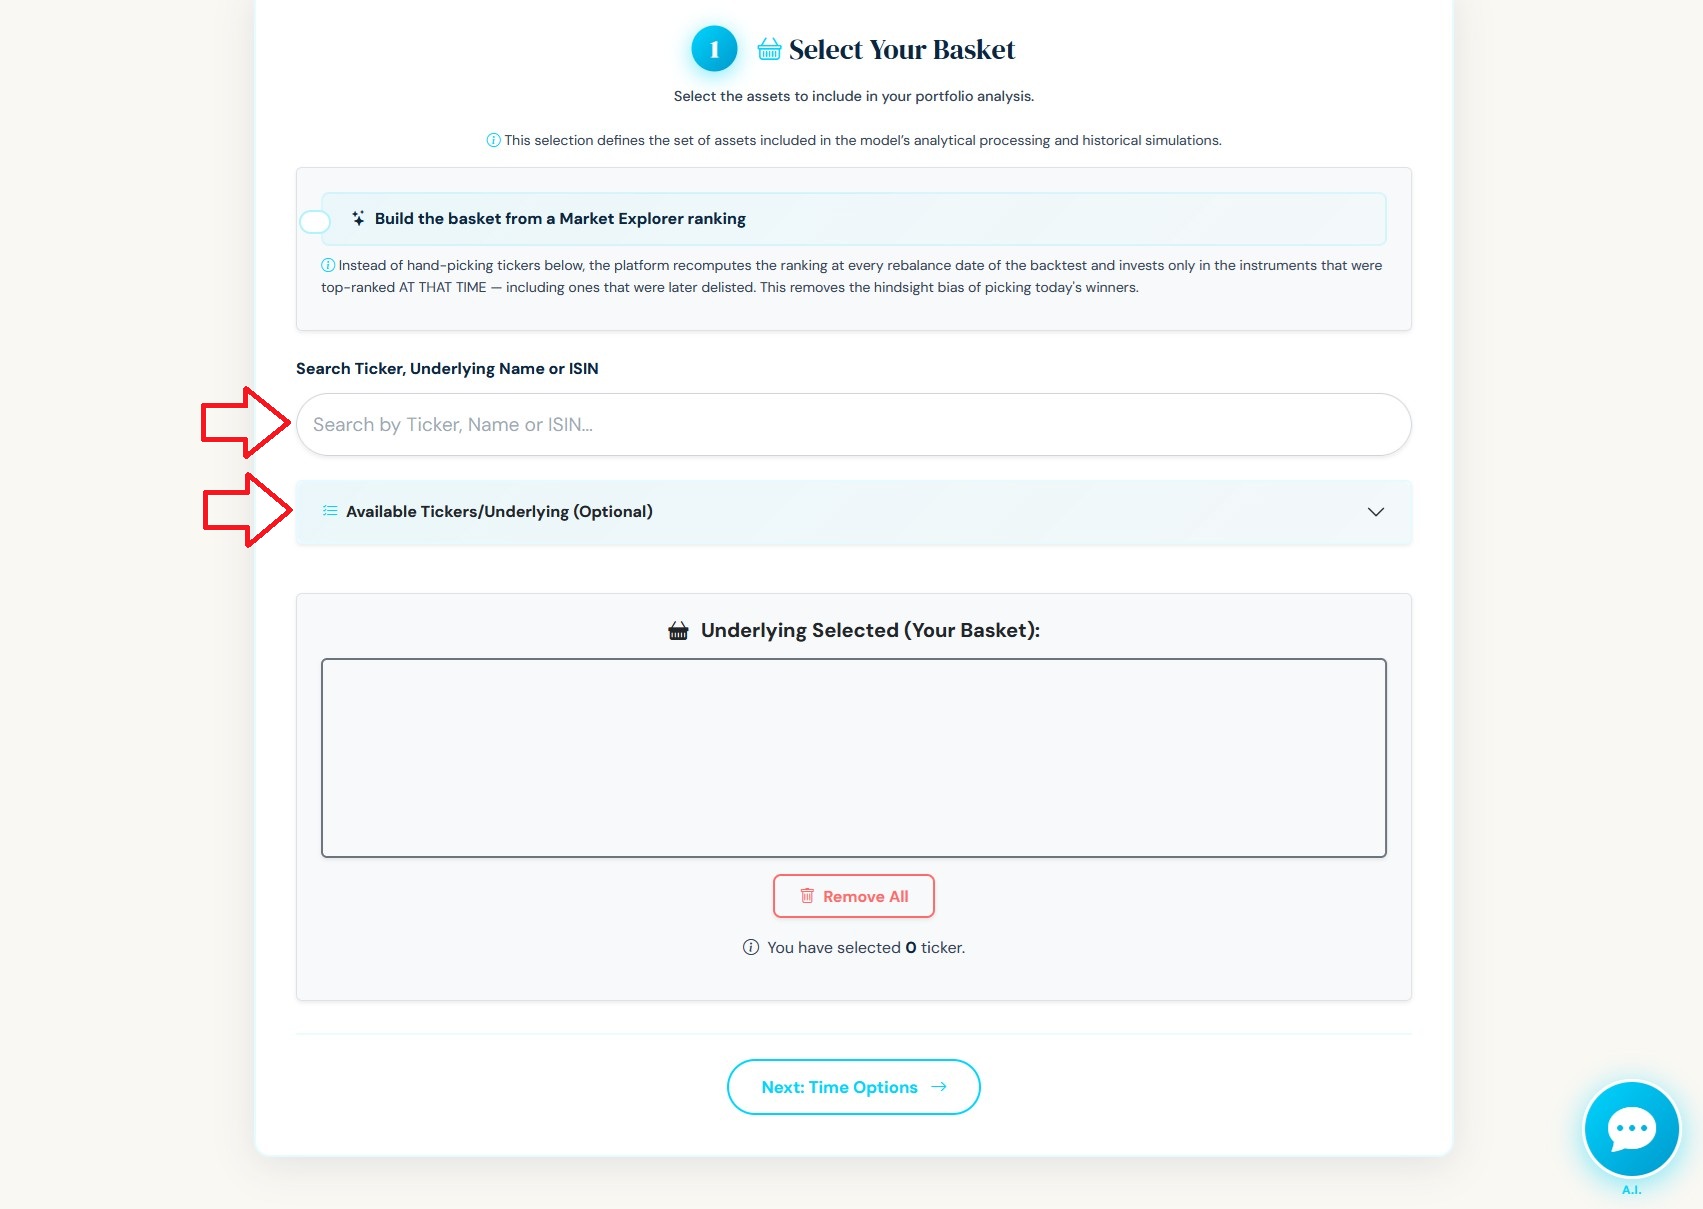
- Search for an instrument by ticker, name, or ISIN, and add it to your basket.
- Or open Available Tickers/Underlying to browse the full list, filter by
category, and add several at once. - Your selections appear under Underlying Selected (Your Basket). Remove any
one, or clear them all.
Use this when you already know exactly which instruments you want to test.
A note on hindsight: hand-picking today's winners for a 10- or 20-year
back-test can flatter the result — you're choosing companies you already know
succeeded. The automatic basket below is designed to avoid exactly that.
Option B — Automatic basket (from a Market Explorer ranking)
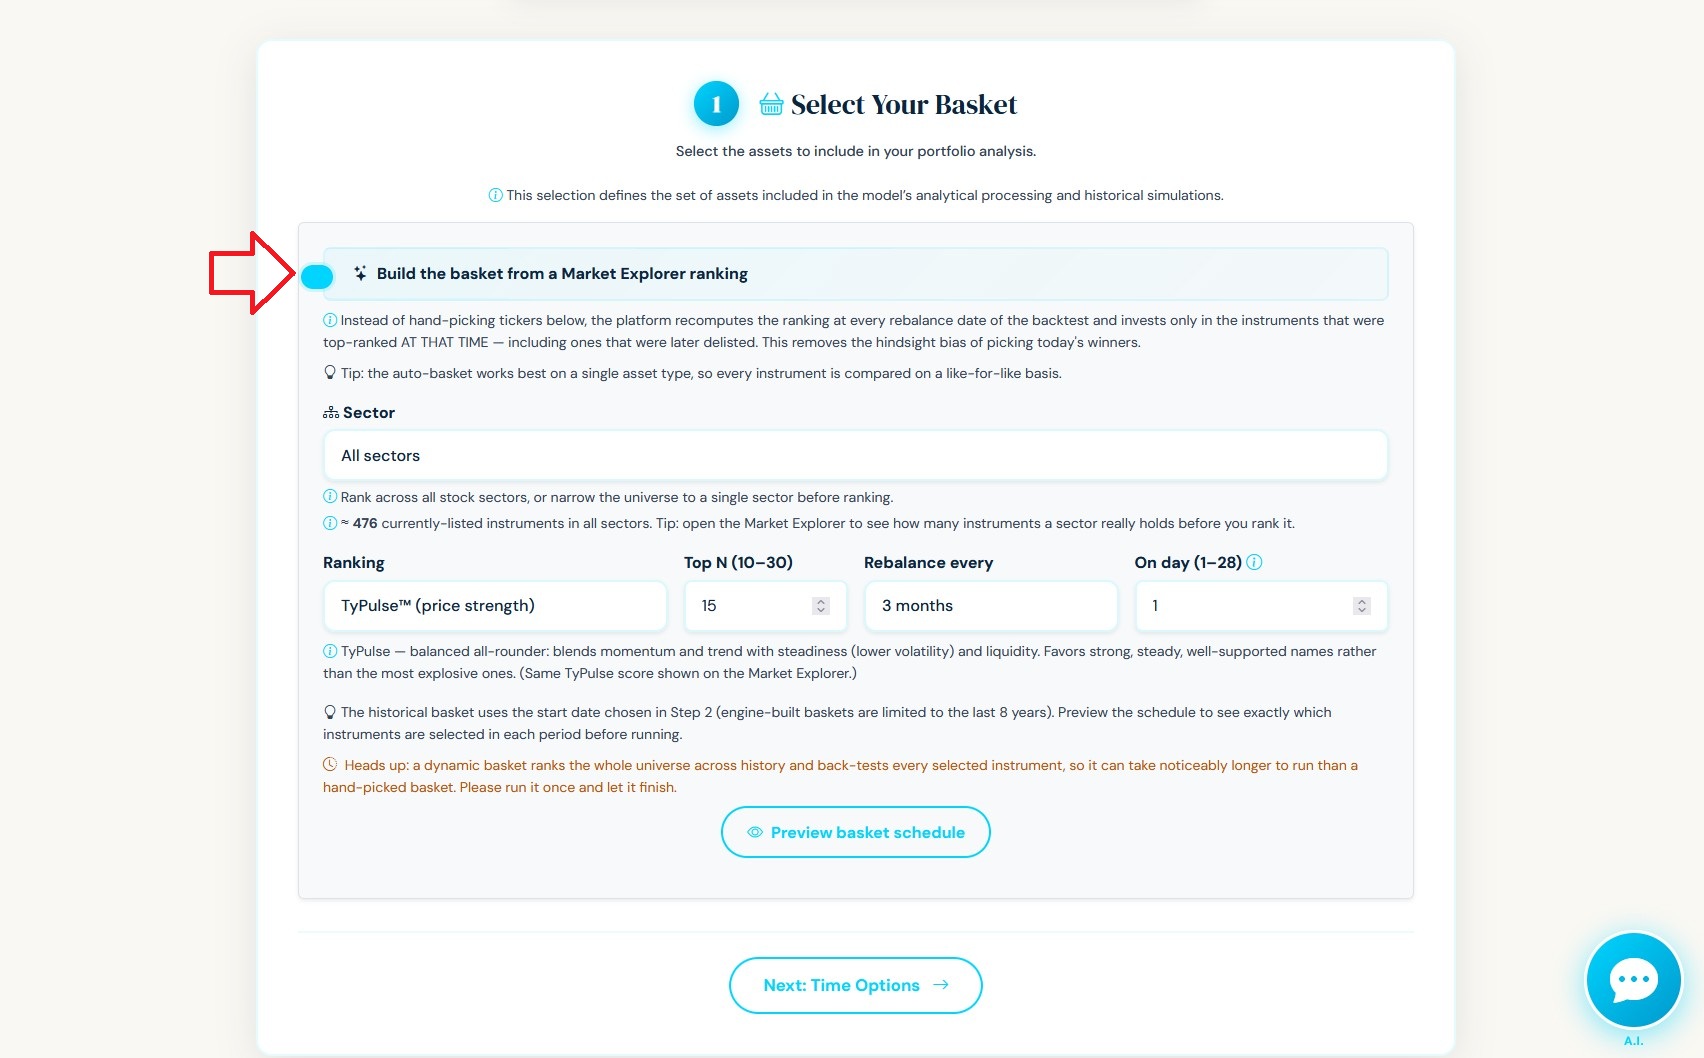
Flip the switch "Build the basket from a Market Explorer ranking" and the
manual picker is replaced by three controls. Instead of a fixed list, the platform
re-ranks the market at every rebalance date and invests in whatever was
top-ranked at that moment in history — companies that later faded, and even
ones that were eventually delisted, are included exactly as they would have looked
at the time. This is what professional platforms call a point-in-time or
dynamic universe, and it removes the hindsight bias of picking today's winners.
The three controls:
- Ranking — the lens used to rank the market. Pick the one that matches the
kind of strength you want to follow:
- TyPulse™ — TyBuff's all-round price-strength score, the same TyPulse
shown on the Market Explorer. It blends several dimensions of price behavior
(trend, momentum, steadiness, and liquidity) into a single read, favoring
strong, steady, well-supported uptrends. (TyPulse is the price-behavior
score; it is distinct from TyScore, the fundamental-quality score on the
Market Explorer.)
- Momentum (6-month return) — ranks by recent half-year performance. Follows
what has been moving up lately.
- Sharpe Ratio (1-year) — ranks by return relative to how bumpy the ride
was. Rewards steadier gains over wild swings.
- Return 1Y — ranks by simple one-year performance.
- Return 3Y — ranks by longer, three-year performance. Favors durable trends.
Which ranking should you pick? They sit on a spectrum from balanced to
return-chasing:
- TyPulse™ is the all-rounder — it is not a pure return chaser. It rewards
momentum and trend but also steadiness (lower volatility) and liquidity, so
it leans toward strong, steady, well-supported names rather than the most
explosive ones.
- Momentum and Return 1Y / 3Y are pure performance lenses — they follow
whatever has risen most. In strong bull markets they can post much higher
back-test returns than TyPulse, but they concentrate in the most volatile names
and tend to suffer deeper drawdowns and sharper reversals.
- Sharpe is the middle ground — it favors return relative to risk.
A practical reminder: a bigger back-test number is not automatically a better
strategy. A pure-momentum basket often wins on raw return in a rising market but
pays for it with a much rougher ride. Always compare the drawdown and
risk-adjusted results, not just the final value.
See them live first. Every ranking offered here — TyPulse, Momentum, Sharpe,
Return 1Y and Return 3Y — is also shown on the Market Explorer page (Tools →
Analysis), for every asset type, using the exact same formulas. Browse the current
top-ranked names there to get a feel for a ranking before you build a basket from it.
-
Top N (10–30) — how many instruments to hold in the ranked universe at each
rebalance. Smaller N = more concentrated and reactive; larger N = broader and
steadier. -
Rebalance every (1 / 3 / 6 / 12 months) — how often the ranking is
recomputed and the universe refreshed. More frequent rebalancing follows the
market more closely (and selects more distinct names over time); less frequent
rebalancing is calmer and more tax/turnover-friendly. -
On day (1–28) — the day of the month each new list is generated (default the
1st). The first list always uses your backtest start date; every rebalance
after that lands on this day, on the chosen cadence — e.g. 3 months · day 15 →
the new lists fall on Apr 15, Jul 15, Oct 15… So the universe is always selected on
the same fixed date of each period, not on whatever day you happen to run the
simulation — results are deterministic and don't change between runs.
Preview before you run. Click Preview basket schedule to see exactly which
instruments were selected in each historical period — full transparency before any
simulation runs.
Best practice: run the automatic basket on a single asset type (Stocks,
ETF, or Crypto). The ranking then compares like with like. On a MIX universe the
platform still works, but it compares stocks, ETFs and crypto together on price
behavior — useful, but less of an apples-to-apples ranking.
Step 2 — Time Options (when the strategy acts)
These settings govern the rhythm of the strategy and are identical for both basket
modes.
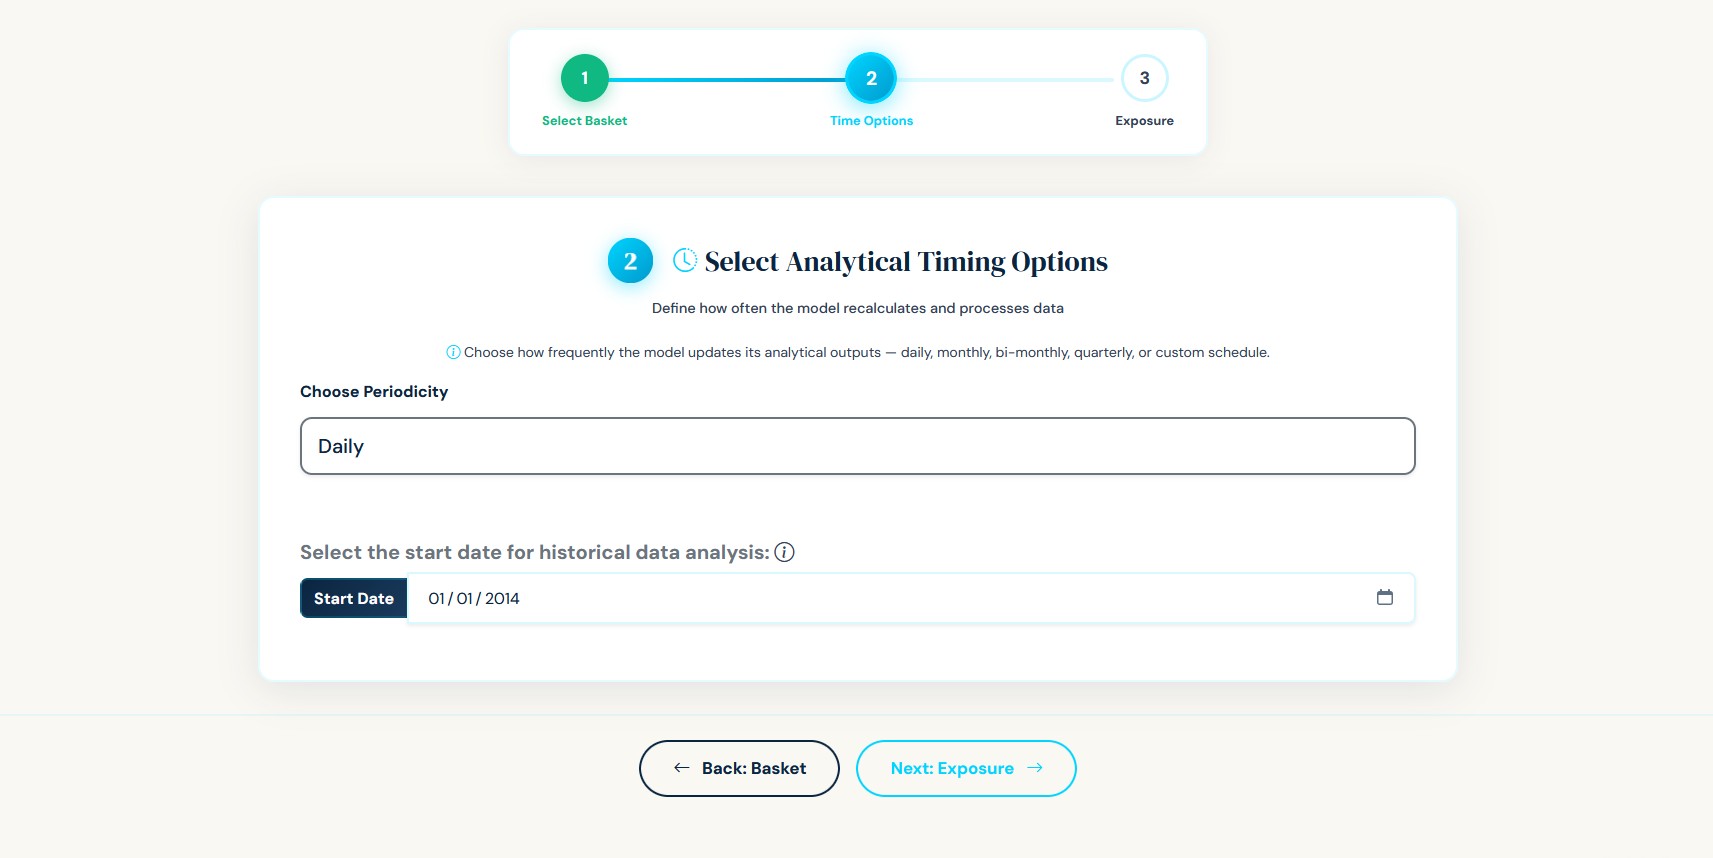
- Periodicity — how often the model re-evaluates: Daily, Monthly,
Bi-Monthly, Quarterly, or Custom. Daily reacts fastest; longer periodicities
trade less often and follow slower, more deliberate signals. - Active months — the months in which the strategy is allowed to act. Leave them
all on for a year-round strategy, or restrict to specific months for a seasonal one. - Analytical Update Day — for non-daily periodicities, the day of the month the
model checks its signals. - Start date — how far back the historical simulation runs. A longer range tells
you more, but takes longer to compute.
Automatic-basket note: engine-built baskets are capped at the last 8 years
of history. This is both a speed limit and an honesty limit — coverage of delisted
instruments thins out the further back you go, so we keep the window where the
point-in-time data is most reliable. (Manual baskets are not capped this way.)
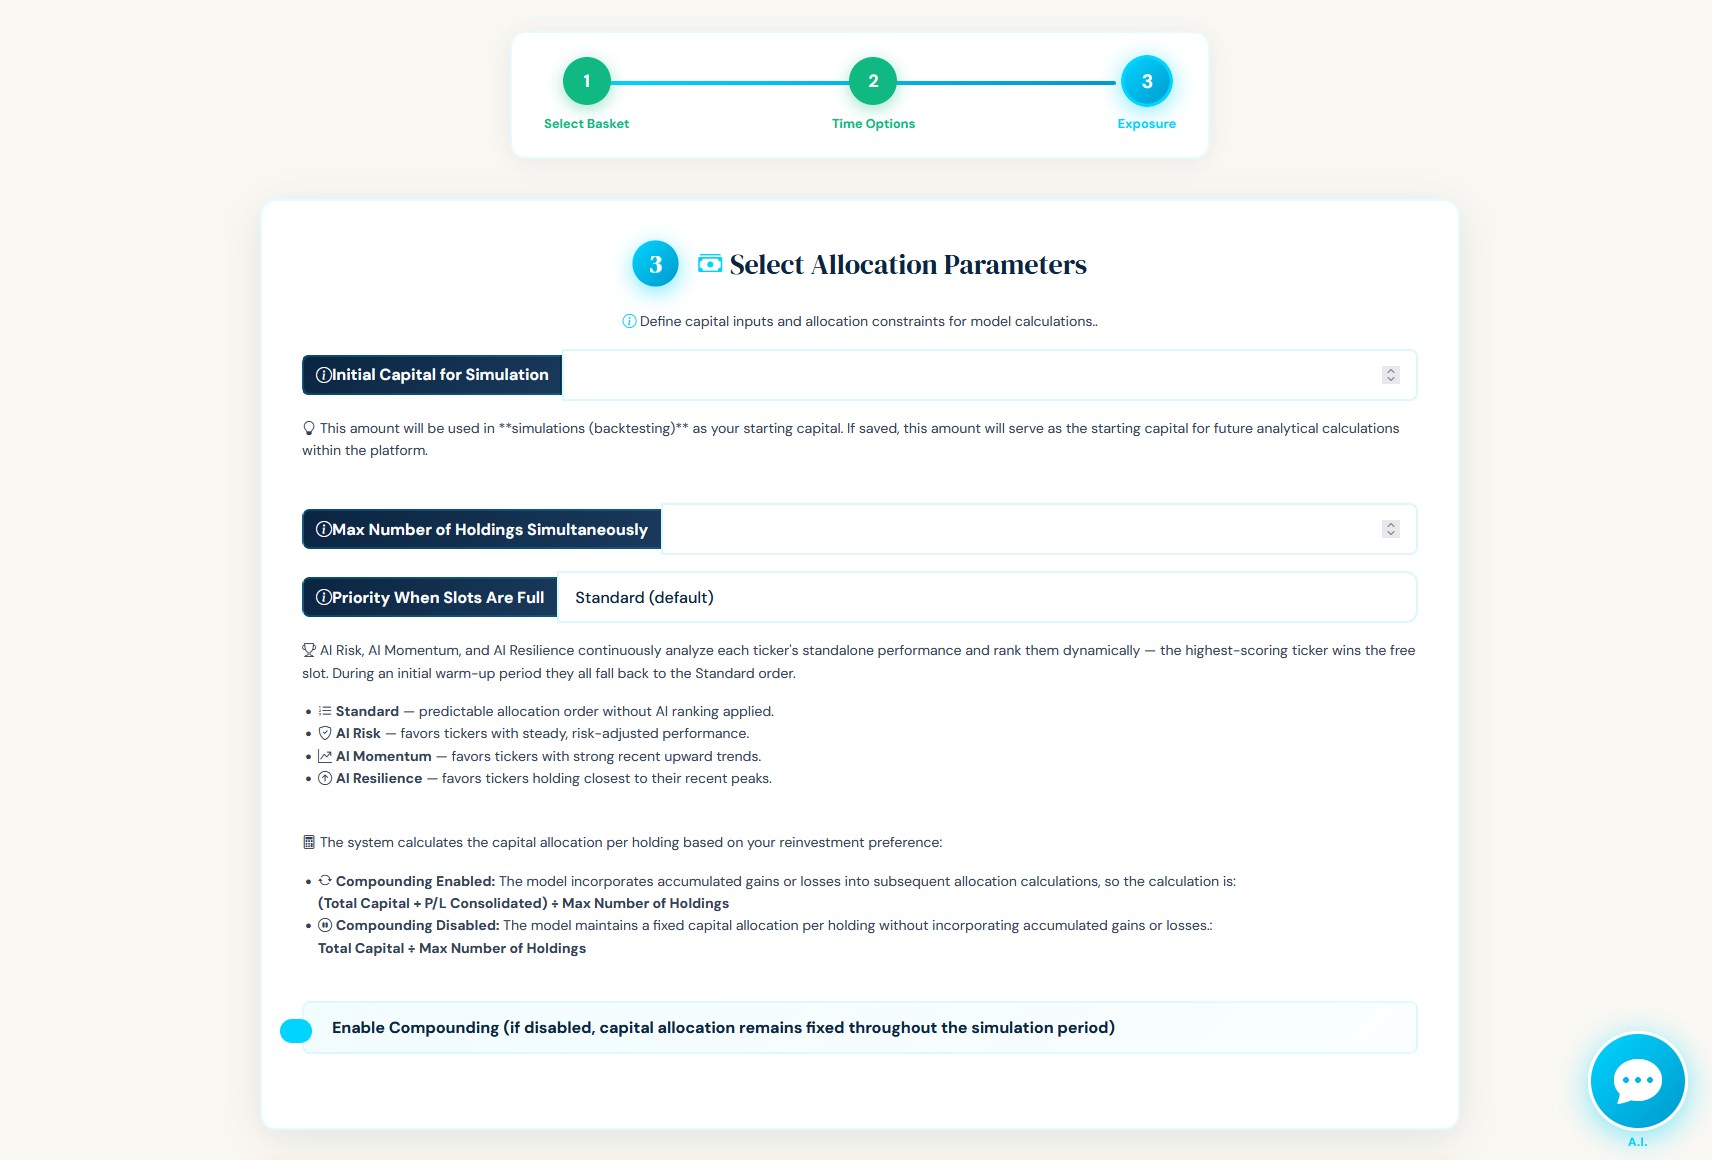
Step 3 — Exposure (how the capital is allocated)
- Initial Capital for Simulation — the starting capital for the back-test (and
your starting point if you later save the strategy). - Max Number of Holdings Simultaneously — how many positions can be open at the
same time. This is the number of "slots." If more instruments signal an entry than
there are free slots, the priority rule below decides who gets in. - Priority When Slots Are Full — when there's competition for a slot:
- Standard — predictable, fixed order (no AI ranking).
- AI Risk — favors instruments with steady, risk-adjusted performance.
- AI Momentum — favors instruments with strong recent upward trends.
- AI Resilience — favors instruments holding closest to their recent peaks.
- Reinvest profits — whether realized gains are added back into the working
capital as the simulation progresses.
How it all fits together
Once you press run, the platform:
- Builds the universe. Manual mode uses your fixed list. Automatic mode walks
the rebalance dates and, at each one, ranks the market as it looked then and
keeps the top N — including instruments later delisted. - Back-tests every instrument that was ever selected, using its assigned model
under your Step-2 timing settings. - Combines them into one portfolio under your Step-3 rules: It applies the signal logic, slot limits, and priority rules for analytical purposes only, showing which assets would have been included at each point in the simulation.
The rule that ties the automatic basket together
In automatic mode there's one extra, intuitive rule — the ranking decides who is
eligible, but your model decides the actual entries and
exits:
A practical detail: a newly-ranked instrument enters on its next fresh signal,
not mid-trend. If it was already in a continuous uptrend when it joined the universe,
the strategy waits for a clean new signal rather than chasing a stale one. With daily
periodicity fresh signals come quickly, so this is barely noticeable; with longer
periodicities, waiting for a clean signal is exactly the disciplined behavior you want.
Saving a dynamic basket as a portfolio
When you save a Strategy-Builder run that used an automatic basket, the platform
freezes the materialized basket schedule onto the portfolio — the exact
from → to → tickers windows you saw in Preview basket schedule, plus the rule
(ranking, Top N, rebalance period, sector). From then on, the portfolio's two
buttons behave like this:
- Historical Simulation and Model Portfolio Snapshot both replay the saved
schedule. Every past period uses exactly the instruments recorded for it — so
your historical results never change, even if new instruments are added to the
platform later. - New rebalance periods (after the save date) are computed when their date
arrives: the platform re-ranks the instruments available at that time (including
newer ones), picks the new period's basket, and then freezes that period too.
So the universe keeps evolving forward, but no past decision is ever rewritten. - Within each period, the saved list is the set of instruments eligible. A position opened earlier keeps being held until the model's own exit,
even if its ticker isn't in the new period's list — and a newly top-ranked
instrument is added only when a slot is free and the model gives a fresh signal.
The rebalance day and the trading day are independent. The basket refreshes on
its rebalance schedule (e.g. a set day each month); the model signals on your
Step-2 schedule (daily, or your chosen evaluation day). Each calendar date always
uses the basket assigned to the period that contains it, so signals are never based
on a basket that has already moved on.
One honest note: a portfolio's historical periods only ever contain instruments
that existed in the platform when it was saved. Two portfolios saved at different
times can therefore differ slightly, because the available universe grew between
them. Each individual portfolio, though, stays perfectly consistent with itself.
Evolving vs fixed universe (a save-time choice)
When you save, you can choose how future rebalance periods are built:
- Evolving universe (default). Each new period re-ranks the current market, so
newly-listed instruments can enter going forward. Best if you want the strategy to
keep discovering fresh opportunities. - Fixed universe (tick "Fix the universe to this backtest's instruments"). Future
periods rank only among the instruments that appeared in this backtest. The
portfolio will never trade an instrument that wasn't part of what you saw when
you saved it — so the live strategy stays strictly auditable against its backtest.
Either way, past periods are always frozen; the choice only governs what future
periods are allowed to consider.
Quick reference
| Manual basket | Automatic basket | |
|---|---|---|
| Who picks the instruments | You | Your ranking, at each rebalance date |
| Universe over time | Fixed | Refreshes every 1/3/6/12 months |
| Survivorship bias | Possible (you pick known winners) | Avoided (point-in-time, incl. delisted) |
| Best for | A specific, known watchlist | Discovering what would have ranked well |
Both modes share the same Step-2 timing and Step-3 exposure controls, and produce
the same kind of fully back-tested portfolio — so you can compare a hand-picked idea
against a disciplined, rules-based universe on equal footing.