There are two ways to teach a machine to read the market, and the difference between them is the difference between a backtest you can trust and one that's quietly lying to you.
The first way — the common one — is to train a separate model for each instrument. One model that has studied only Apple, another that has studied only Bitcoin, each tuned until it fits its own history beautifully. It feels precise. It is, in fact, the single most reliable way to fool yourself in this entire field.
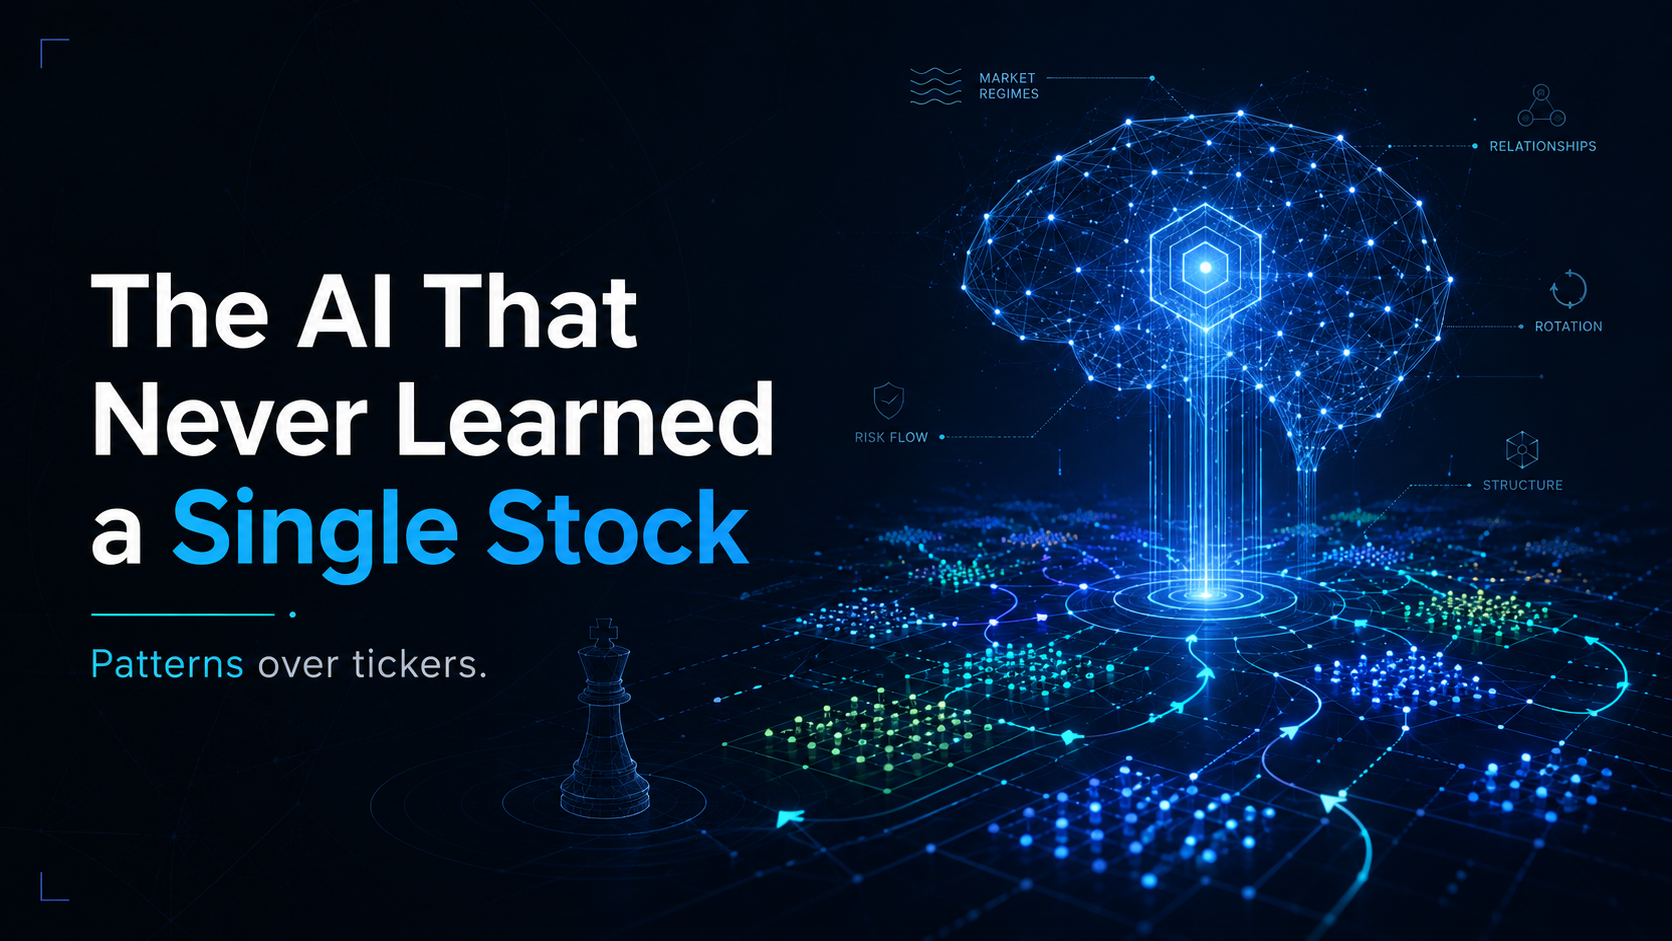
The second way is the one we chose. And the simplest way to describe it is a little strange: TyBuff's signal engine never learned a single stock.
The overfitting trap
To see why "never learned a single stock" is a feature and not a bug, you have to understand the quiet villain of every trading model: overfitting.
Overfitting is what happens when a model stops learning how markets behave and starts memorizing what this particular price chart already did. A model trained on one instrument's history has a small, narrow dataset, so it has every opportunity to memorize the noise — the random wiggles that will never repeat — and mistake it for signal.
The result is seductive and dangerous. The model produces a gorgeous backtest, because it has essentially studied the answer key. Then you point it at tomorrow, which isn't in the answer key, and it falls apart. Researchers put it bluntly: if a model only works on one asset, it's probably overfitted. A strategy that can't survive being pointed at a different market never really had an edge — it had a good memory.
This is the hidden reason so many "AI trading" tools look incredible in a demo and disappoint in real life. The demo is the answer key. Live trading is the exam.
One model, learning the grammar — not the vocabulary
So we built the engine the other way around. Instead of many narrow models that each memorize one instrument, TyBuff uses a single, asset-agnostic model trained on generalized market behavior. During training it doesn't "see" Apple or Bitcoin or any specific ticker — it sees the underlying statistical patterns that show up across thousands of instruments and decades of history.
Think of it as the difference between memorizing a thousand sentences and learning the grammar of a language. Memorize the sentences and you're helpless the moment someone says something new. Learn the grammar and you can read a sentence you've never seen before. We wanted the grammar.
This isn't a contrarian hunch — it's where the research points. Studies comparing the two approaches have found that a universal model trained on pooled data from hundreds of stocks consistently outperforms the stock-specific models, and — crucially — generalizes to instruments it was never trained on. The reason is exactly the overfitting story in reverse: pooling a vast, varied set of market scenarios gives the model such a rich training ground that it's pushed to learn the durable patterns instead of memorizing any one chart's noise.
That's the whole design philosophy in one line: learn what's true across all markets, so you're not fooled by what was true in one.
What the engine actually does
Once trained, the model is applied to end-of-day market data and produces a simple position-level output for each instrument: an on/off read on each instrument, under the parameters you set.
A few things follow from that, and they're deliberate:
- It works across asset types. The same universal framework reads a stock, an ETF, or a crypto coin — because it learned general market behavior, not one asset class's quirks. No separate model to maintain per instrument, no constant recalibration.
- It's a steady, end-of-day discipline, not a frantic one. This is a tool for considered, research-driven decisions — not millisecond scalping. For the kind of investor we build for, that's the point.
- You stay in control. The engine produces analytical signals; the decisions remain yours. It's built to support independent research, not to replace your judgement or make promises about what happens next.
Where it fits: the three-layer loop
The signal engine is powerful on its own, but its real value shows up as one layer in a stack — and this is where TyBuff does something most tools don't bundle into a single product:
- What to consider — your basket. Hand-pick it, or let the point-in-time dynamic basket re-rank the market as it really looked at each moment in history (delisted names included).
- When to act — the universal signal engine. On every instrument that's eligible, it produces the on/off read, on your timing.
- How it would have played out — the backtest. The whole strategy runs across real history so you can judge it on return and drawdown before risking a cent.
Most products give you a slice of one layer. A popular AI scorer hands you a rating on a stock and stops. An alert service fires a pattern signal and stops. A pro-grade backtester gives you the engine room but makes you build the model yourself. TyBuff stitches all three together — the universe, the signal, and the honest backtest — into one loop, with you holding the wheel the whole way.
The honest part
We'd rather you trust this engine for the right reasons than oversell it into something it isn't.
- Reducing overfitting is not the same as predicting the future. A universal model removes one specific, lethal failure mode — memorizing a single chart. It cannot remove uncertainty. Markets change regimes; no model, however general, knows tomorrow.
- Generalization is a trade-off, and we made it on purpose. A model tuned obsessively to one instrument might look sharper on that instrument's past — right up until that sharpness turns out to be memorized noise. We chose durable and broadly-applicable over dazzling-on-one-chart, because the second kind is the kind that breaks live.
- Signals support decisions; they don't make them. Everything here is built to inform your own research. It is not advice, and it is not a guarantee. The control — and the responsibility — stays with you.
None of that softens the case. It is the case. An engine designed to learn the grammar of markets rather than memorize one chart, that you can point at any asset, and whose every decision you can back-test against real history, is a tool built to make you a sharper investor — not to sell you a miracle.
See it work
The fastest way to feel the difference is to build a strategy and watch the engine trade it through history — first on a basket you choose, then on a point-in-time ranking — and read the drawdowns as carefully as the returns. One model, every asset, every decision yours: that's the engine under the hood of everything TyBuff does.