Every investor eventually asks the same question in front of a ticker: is this actually good — right now?
It's a harder question than it sounds. "Good" hides a dozen sub-questions. Is it cheap or expensive? Is the business profitable and durable? Is it growing? Is the market already rewarding it, or ignoring it? You can answer each by hand, but doing it consistently across thousands of stocks, ETFs and coins - in a way you can actually compare - is where most people give up.
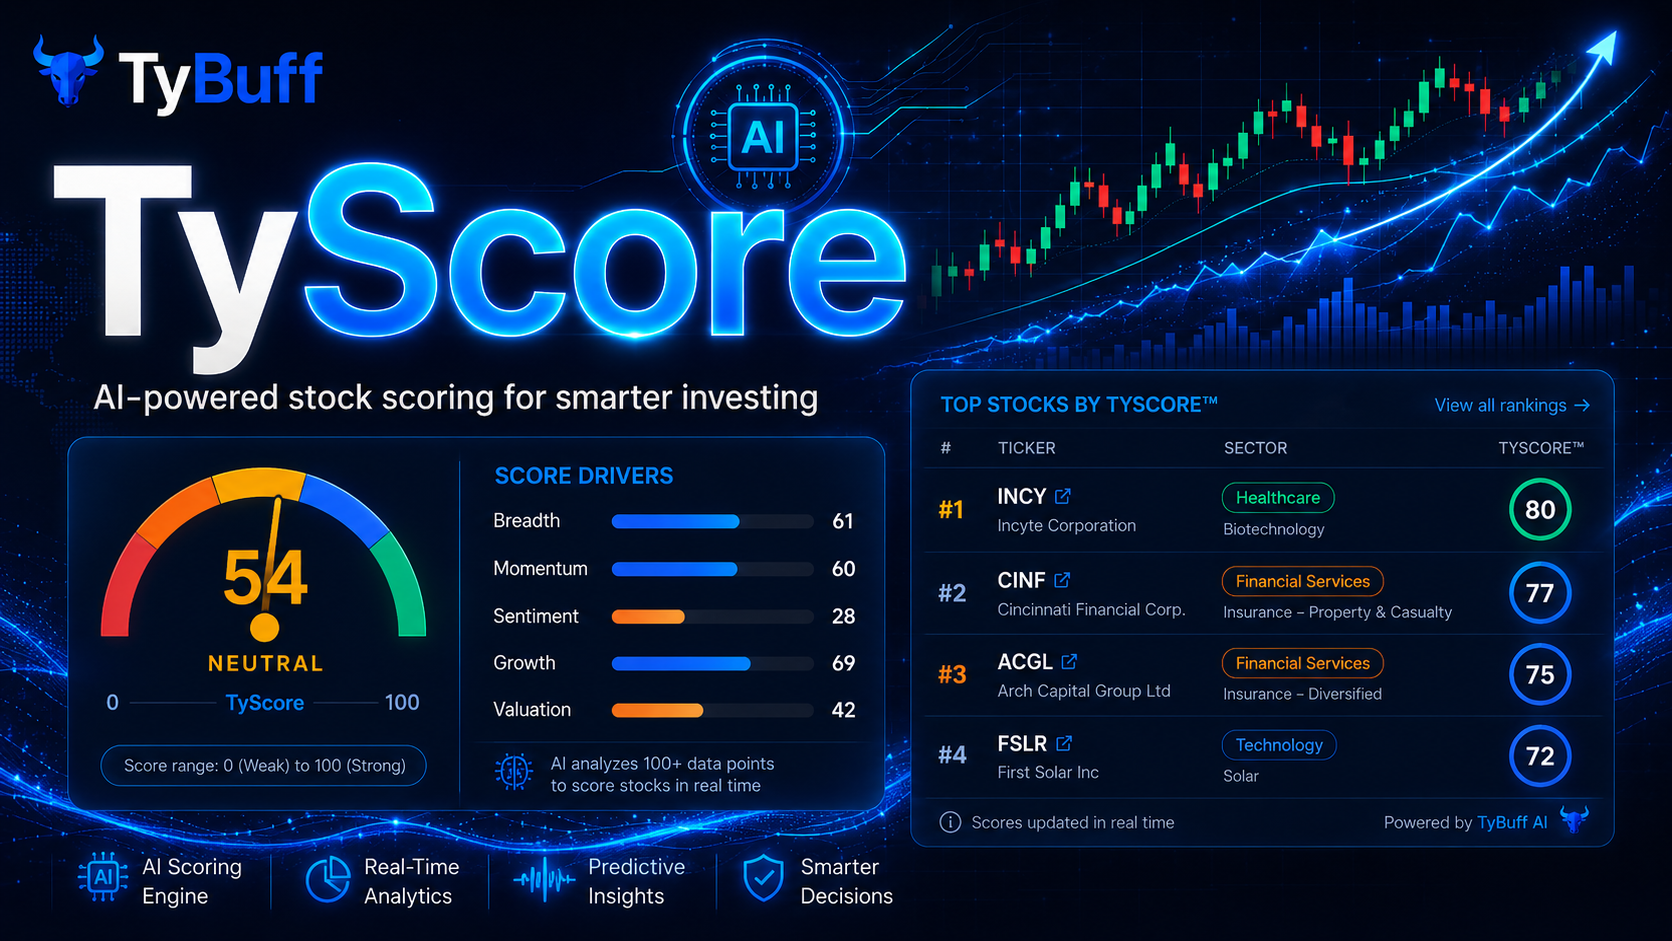
TyScore is our answer to that. It's a single number from 0 to 100 that summarises the quality of an instrument at this moment, so you can rank, compare and shortlist in seconds instead of hours.
One number, four pillars
A score is only useful if you know what's underneath it. TyScore is built from four equally-weighted pillars. For a stock, they are:
- Value — are you paying a fair price for what you get?
- Quality — is the underlying business genuinely strong: profitable, efficient, not drowning in debt?
- Growth — is the business actually getting bigger over time?
- Momentum — is the market trend confirming the story, or fighting it?
Each pillar contributes a quarter of the final score. That balance is deliberate. It means a cheap, strong, growing company can still score well even when its price chart is having a bad month - Momentum is only one voice of four, not the whole verdict. We sometimes describe this as "quality on sale," and it's exactly the kind of setup that's easy to miss when you're staring at a falling price.
Different assets get a different lens
Here's something most scoring systems get wrong: they judge an ETF the same way they judge a stock. That doesn't make sense. An index fund doesn't have a profit margin; a coin doesn't have a price-to-earnings ratio.
So TyScore doesn't use one formula - it uses a different engine for each kind of asset:
- Stocks are scored on Value, Quality, Growth and Momentum, as above.
- ETFs and funds (where we have the data) are scored on what actually matters for a fund: cost, quality, performance and risk-adjusted return. A cheaper, well-rated, steady fund rises to the top.
- Crypto and price-only instruments are scored purely on what the market gives us — risk, liquidity, momentum and trend — because there are no fundamentals to lean on.
The number always lands on the same familiar 0–100 scale, so you can read it the same way everywhere. But under the hood, each asset is being judged on its own terms.
"Universal" vs "vs Peers"
A score with no context can mislead. Is a 78 impressive? It depends on compared to what.
TyScore gives you two answers:
- Universal — how the instrument ranks against its entire class (its asset type and currency). This is the stable number: it doesn't change just because you applied a filter.
- vs Peers — how it ranks against the narrower group you're actually looking at, once you filter by sector, category or size. This is where a "good" stock can suddenly look only average — because now it's being measured against its real competitors.
Reading both together is the trick. A high Universal score with a mediocre vs-Peers score tells a very different story than two high scores.
What TyScore is - and isn't
TyScore is a research starting point, not a buy button. It's designed to do the heavy, repetitive comparison work so you can spend your attention on the handful of names worth a closer look. It compresses a lot of data into one honest, comparable signal.
What it isn't: a prediction, a guarantee, or a substitute for understanding why a company or fund scores the way it does. The best way to use it is as a filter and a prompt — find the high scorers, then ask what's driving them, and whether you agree.
Try it on something you own
The fastest way to understand TyScore is to look up something you already hold an opinion about. Pull up a stock you think is great — does its score agree? Check one you're suspicious of. When the number surprises you, that's the moment it earns its keep: it's pointing at something your gut hadn't weighed yet.
That's the whole idea - not to replace your judgement, but to make sure it's looking at the full picture.