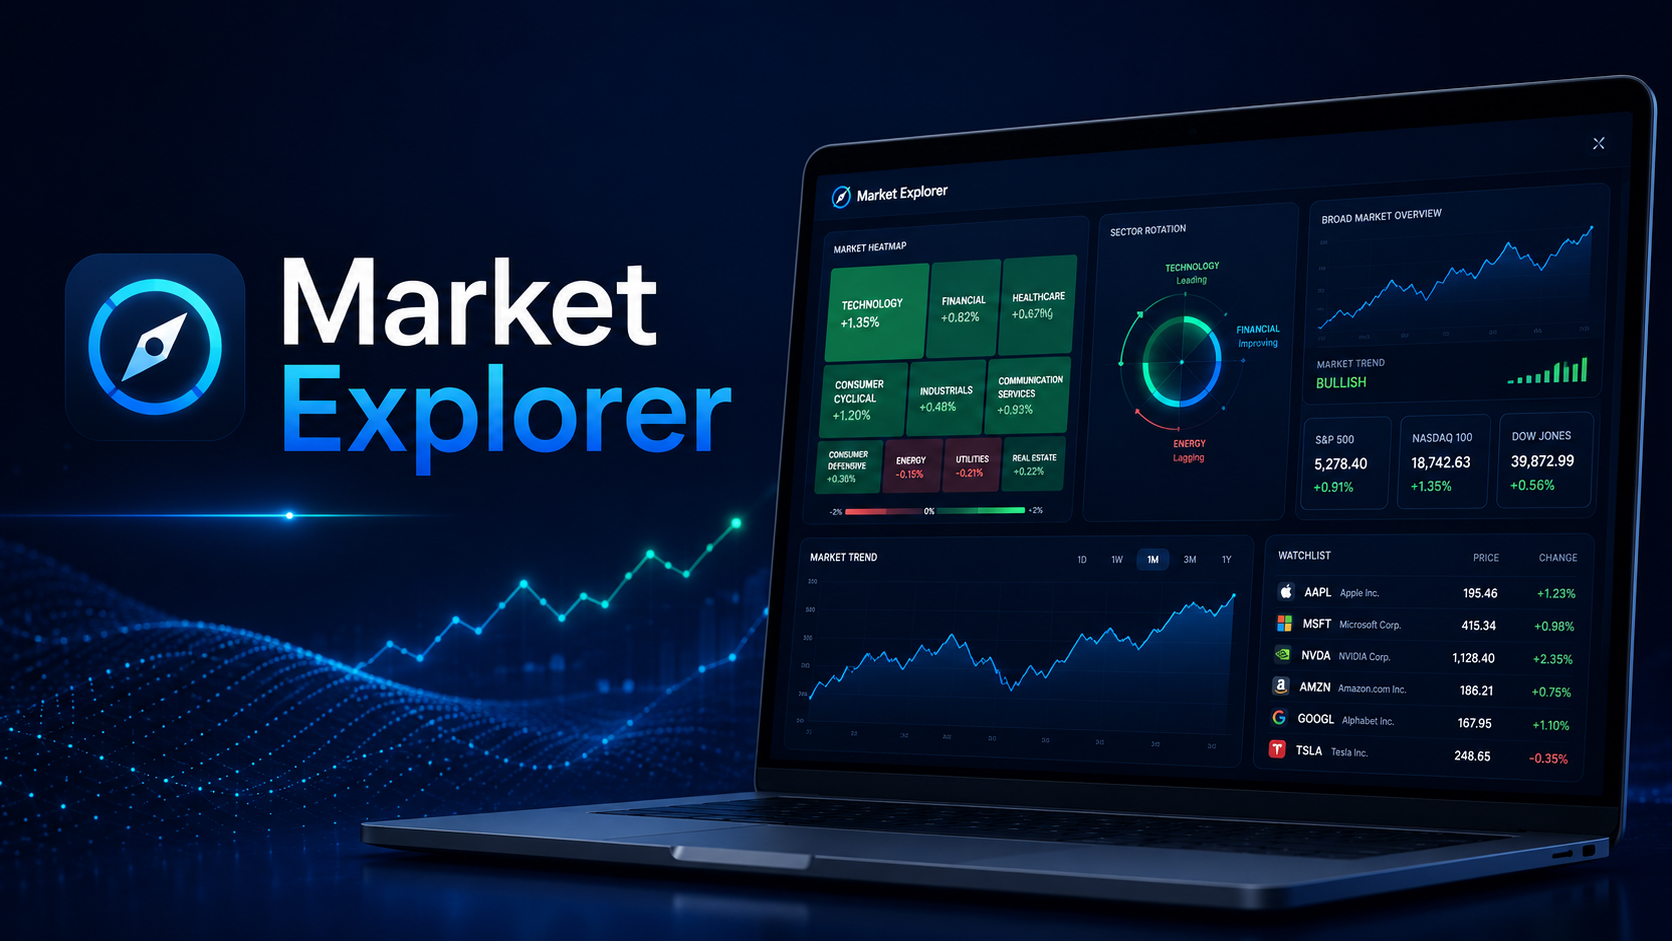
The Market Explorer — A Step-by-Step Guide
Most screeners make you study the market one ticker at a time. The Market Explorer
does the opposite: it shows you the whole market at once — filtered to the cohort you
care about, read through TyBuff's scoring, and laid out as a single scrollable dashboard
of mood, movers, rankings, maps, and sector views.
This guide walks through every panel, top to bottom, and ends with the part that makes the
page more than a dashboard: turning a ranking into a dynamic strategy.
One idea first, kept in view throughout:
TyBuff is an analytical platform, not a financial adviser. Every score, gauge, and
ranking here is an analytical output computed from historical and market data. None of
it is a recommendation or an instruction to trade. The page is built to help you read
the market; the decisions stay yours.
Before you start: access
The Market Explorer is part of the Advanced and Professional plans (it may appear
in a private beta first). If your plan doesn't include it, you'll see an upgrade preview
listing what's inside — TyScore, Market Mood, the Earnings Calendar, the Market Map, the
rankings, the sector breakdown, and the smart filters — rather than empty space.
The two scores: TyScore and TyPulse
Everything on this page is read through two proprietary lenses, and understanding the
difference is the key to the whole Explorer.
- TyScore™ — a single 0–100 fundamental-quality score for stocks and funds that
have data coverage. It condenses 16 fundamentals into four factors — Value,
Quality, Growth, and Momentum — and uses a different engine per asset type, scoring
only like against like (stocks vs stocks, ETFs vs ETFs, same currency). A high score
favors quality and value, so a strong company can rank high even with its price down —
"quality on sale" — because momentum is only one of the four factors. - TyPulse™ — a pure price-strength score available for every asset type. It's
the headline score for crypto and instruments without fundamental coverage, and a
complementary lens for stocks and funds.
In short: TyScore tells you how good the business is; TyPulse tells you how strong the
price is. Instruments without fundamentals (like crypto) have a TyPulse but no TyScore.
Click How it works on the TyScore banner for the per-asset-type factor breakdown.
Step 1 — Set your filters
A filter bar sits near the top and drives the entire page. Set it, press Apply Filters,
and every panel below re-computes around your cohort:
- Asset Type — stocks, ETFs, crypto, and so on.
- Sector / Category — narrow to one sector or leave it on All.
- Currency — the Explorer compares like with like, so you work within one currency.
- Market Cap — Mega (>$200B), Large ($10–200B), Mid ($2–10B), Small ($300M–2B), or
Micro (<$300M).
A small count shows how many instruments match. Tip: a tighter cohort makes every panel
below — especially the rankings and the heatmap — sharper and more comparable.
Step 2 — Market Mood: fear vs greed at a glance
The Market Mood gauge gives you one read on where your filtered cohort sits today
between fear and greed. It's a fast sentiment temperature for the slice of the
market you're looking at — useful context before you read anything else, and a reminder
that the same names look very different in a fearful tape than a greedy one. (It's a read
on conditions, not a call to act on them.)
Step 3 — Earnings Calendar and Movers
Two quick situational-awareness panels:
- Earnings Calendar — upcoming reports over the next 45 days, sorted by date, so a
name's next catalyst is never a surprise. - Movers Today — four lists at a glance: Top Gainers, Top Losers, names Near
52-Week Highs (a breakout watch), and names Near 52-Week Lows (a capitulation
watch). They're descriptive snapshots of where price extremes are clustering right now.
Step 4 — Market Pulse and the TyPulse panel
- Market Pulse — a compact row of cards summarizing the filtered cohort at a glance.
- TyPulse™ — Price Strength — a panel showing where the whole cohort sits on price
strength right now, so you can see at a glance whether you're looking at a strong,
broad-based tape or a weak one.
Step 5 — Market Map and Rankings
This pair is where you go from "overview" to "specific names."
- Market Map — a bubble chart plotting valuation against growth (P/E ratio vs 3-year
EPS growth), with bubble size = market cap. It's an instant visual of who's cheap,
who's growing, and how big — the expensive-but-fast names separate visibly from the
cheap-but-slow ones. - Rankings — the top 10 per dimension, with tabs to slice the cohort multiple ways
(the strength and quality lenses you'd expect). Click any row to open that instrument's
full detail page in the Screener.
Step 6 — The Market Heatmap
The Market Heatmap is a treemap of your cohort: tile size = market cap, tiles
grouped by sector, showing the top 140 by size. Toggle it between:
- % Change — to see where today's green and red are concentrated, sector by sector, and
- TyScore — to see where the quality clusters.
Click any tile to open that instrument. It's the single best "where is everything, and how
is it doing?" view on the page.
Step 7 — Sector Rotation and Sector Overview
Zoom back out to the sector level:
- Sector Rotation — a quadrant mapping each sector on strength vs momentum, sorted
into Leaders (strong and trending up), Improving (weak but turning up),
Weakening (strong but losing steam), and Lagging (weak across the board). It's a
classic rotation read, computed on your cohort. - Sector Overview — aggregated metrics per sector, for a side-by-side of quality,
momentum, and valuation across the market.
Step 8 — From a ranking to a strategy (the part that ties it together)
Here's what makes the Market Explorer more than a dashboard. Every ranking lens you see
here — TyPulse, momentum, Sharpe, 1-year and 3-year return — is also available inside
the Strategy Builder as the engine for a dynamic basket.
That means you can go from reading the market to acting on it systematically:
- Use the Explorer to get a feel for a ranking and the cohort it surfaces.
- Open the Strategy Builder and switch on "Build the basket from a Market Explorer
ranking." - Pick the same lens, choose how many names to hold and how often to rebalance, and the
engine re-ranks the market at every rebalance date — investing in whatever was
top-ranked at that moment in history, delisted names included.
That last detail is what professionals call a point-in-time (or dynamic) universe, and
it removes the hindsight bias that flatters most do-it-yourself back-tests. (For the full
walkthrough, see The Strategy Builder — A Step-by-Step Guide and How to Backtest a
Strategy Without Fooling Yourself in Insights.)
A quick workflow
- Filter to the cohort you care about and Apply.
- Read the mood and the TyPulse panel for overall conditions.
- Scan Movers, the Heatmap, and Sector Rotation for where the action is.
- Use the Market Map and Rankings to surface specific names.
- Click through to any instrument's Screener detail page to study it.
- Take a ranking into the Strategy Builder to turn a read into a back-tested strategy.
What this page is — and what it isn't
To be completely clear, consistent with our
Terms & Conditions and
Full Disclaimer:
- TyBuff is a technology and analytics provider, not a registered investment
adviser. The Market Explorer does not consider your personal circumstances,
objectives, or risk profile. - TyScore, TyPulse, the mood gauge, rankings, maps, and sector reads are automatically
generated from historical and market data. None of it is a recommendation, a trading
signal, or an instruction to buy, sell, or hold anything. - Fundamentals are cached and updated periodically, so always sanity-check freshness for
anything time-sensitive. - Past data and analytical outputs do not guarantee future results. Markets carry
substantial risk, including the loss of your entire investment. - Everything here is for educational and informational purposes only. Always do your own
research and consult a qualified financial professional before making investment decisions.
In short: the Market Explorer turns the entire market into a single, readable screen — and
hands any ranking straight to the Strategy Builder when you want to act on it. What any of it
means for you is always, and only, your call.